
H1 2026: Amounts hold. Deal count suffers.
Total, equity and debt raised were stable compared to H1 2025. But the dip in number of ventures raising is a red flag

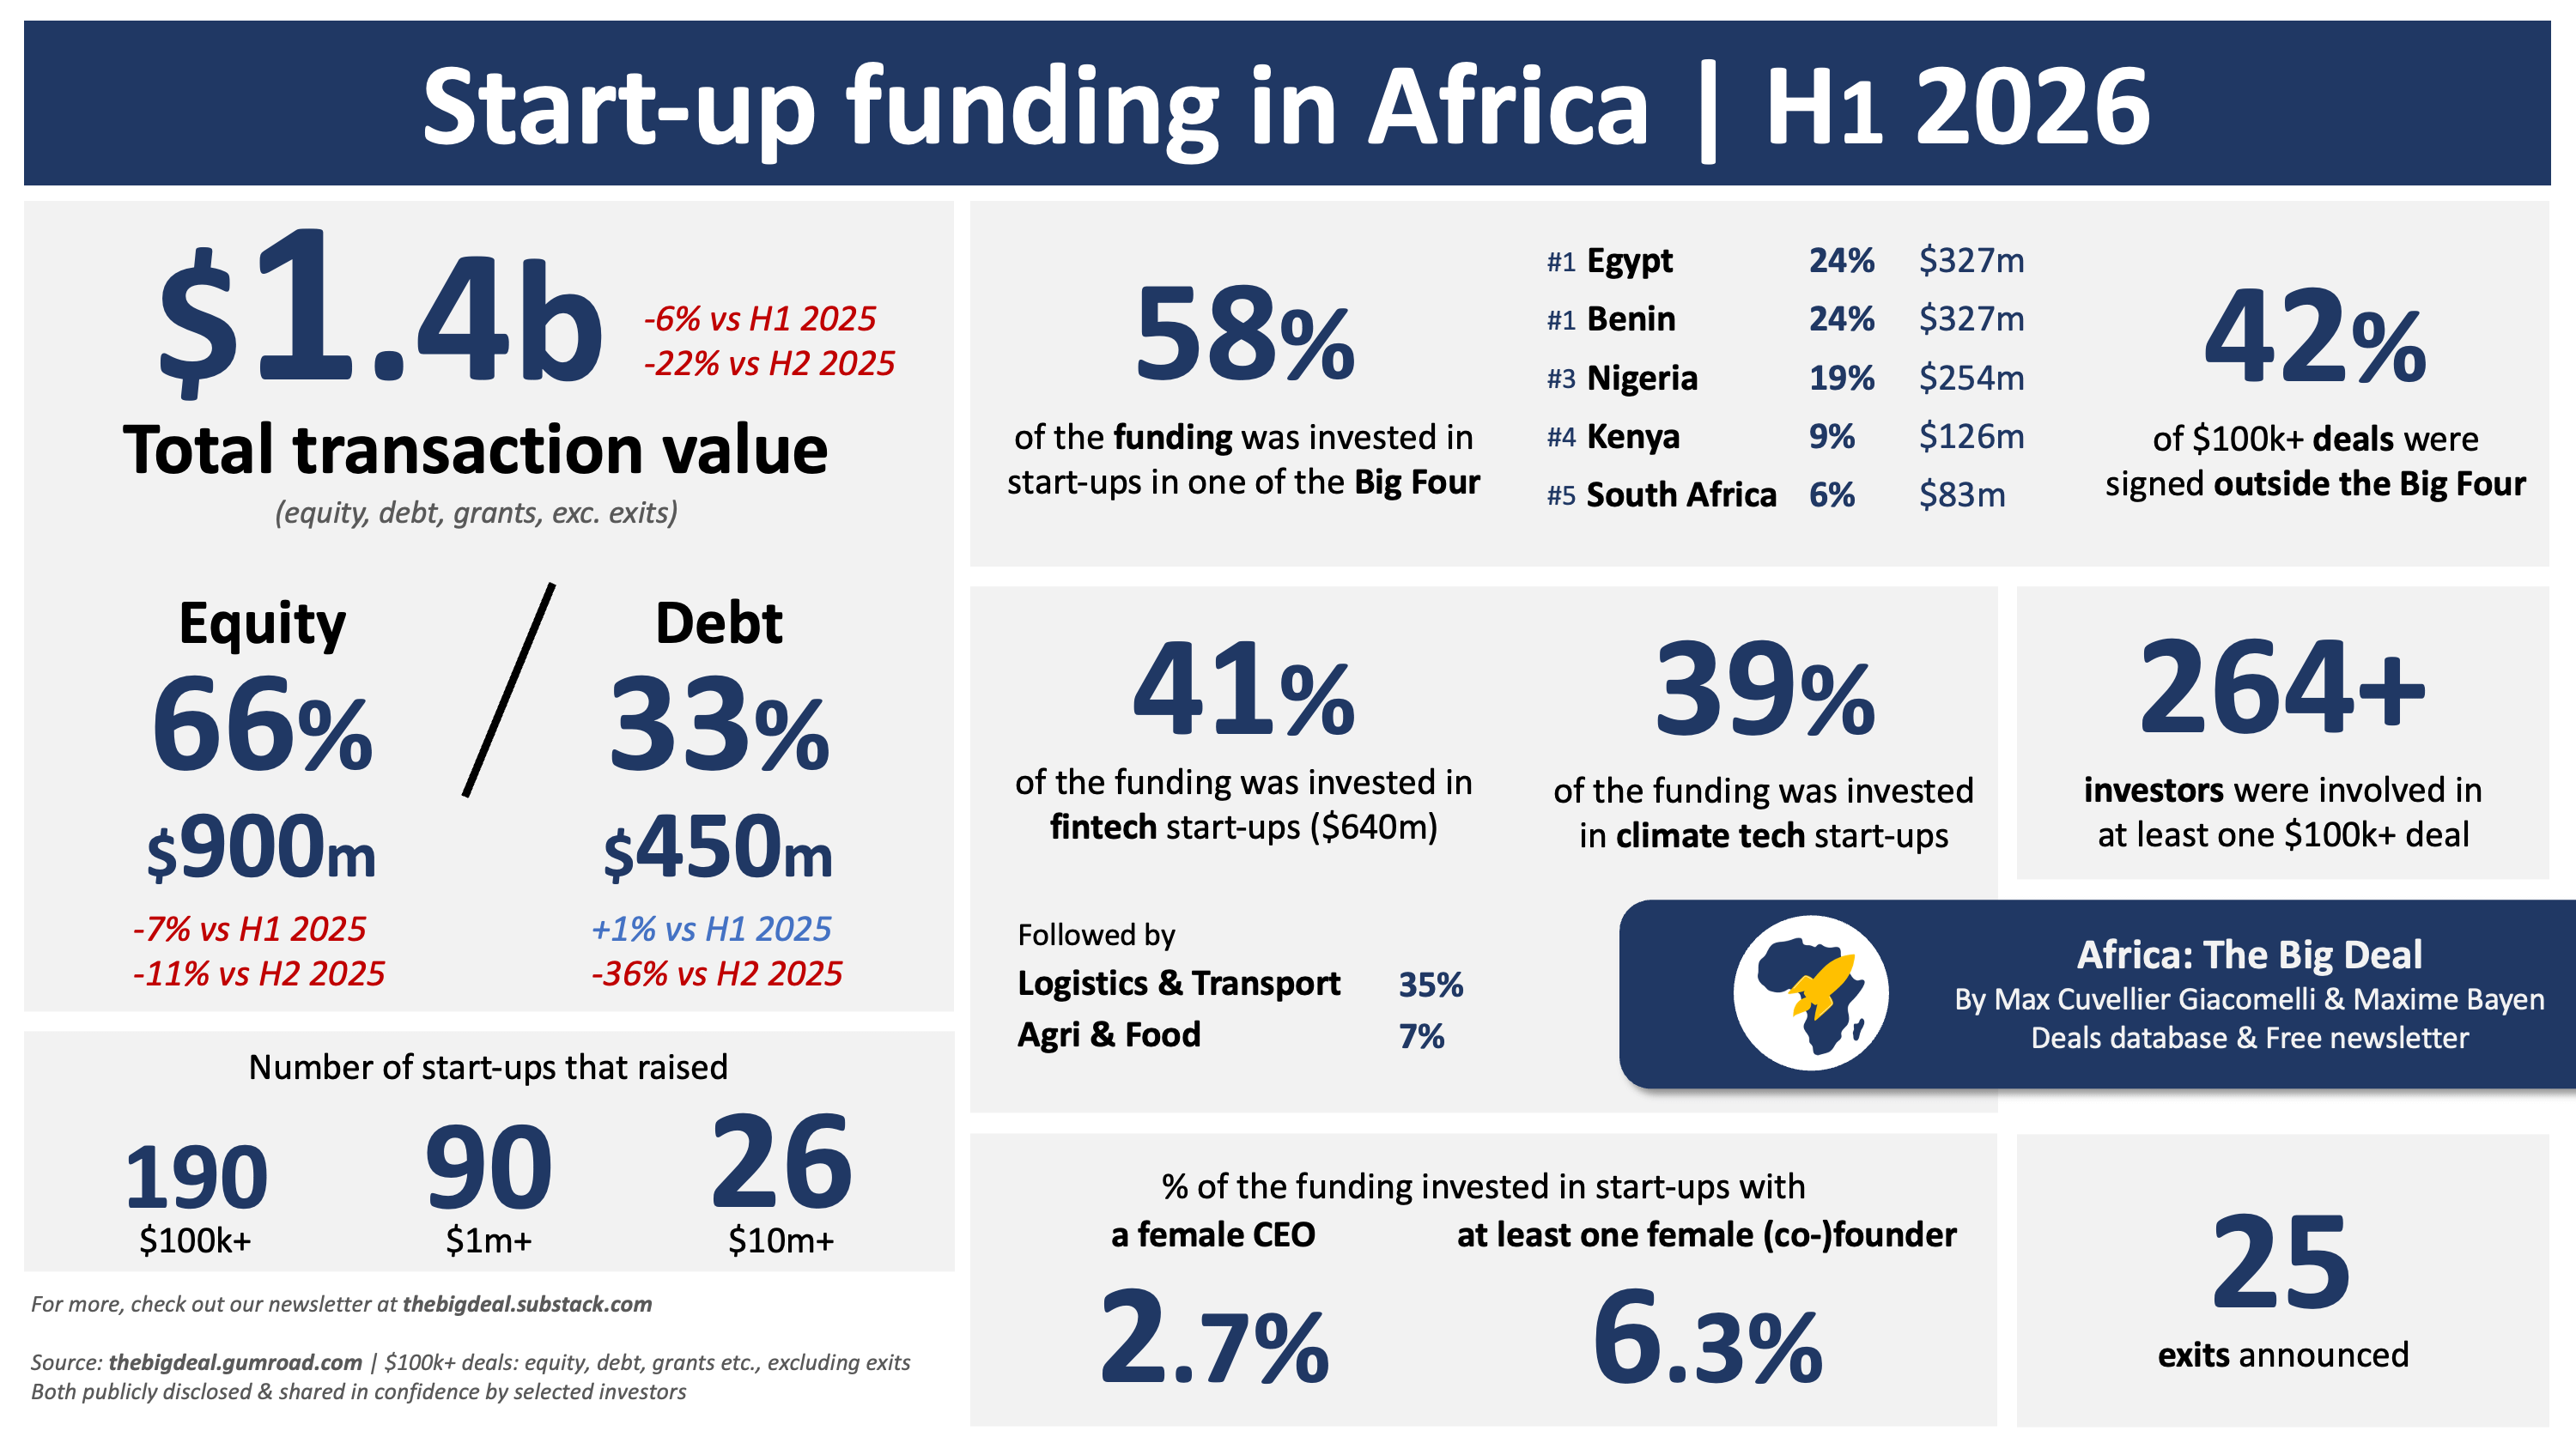
On Tuesday, we published the first post in our H1 2026 series, focused on how the very strong June performance made up for an otherwise underwhelming start of the year. Today, we’ll start diving into the H1 numbers themselves: total raised, number of ventures, equity vs. debt, exits etc. Let’s go:
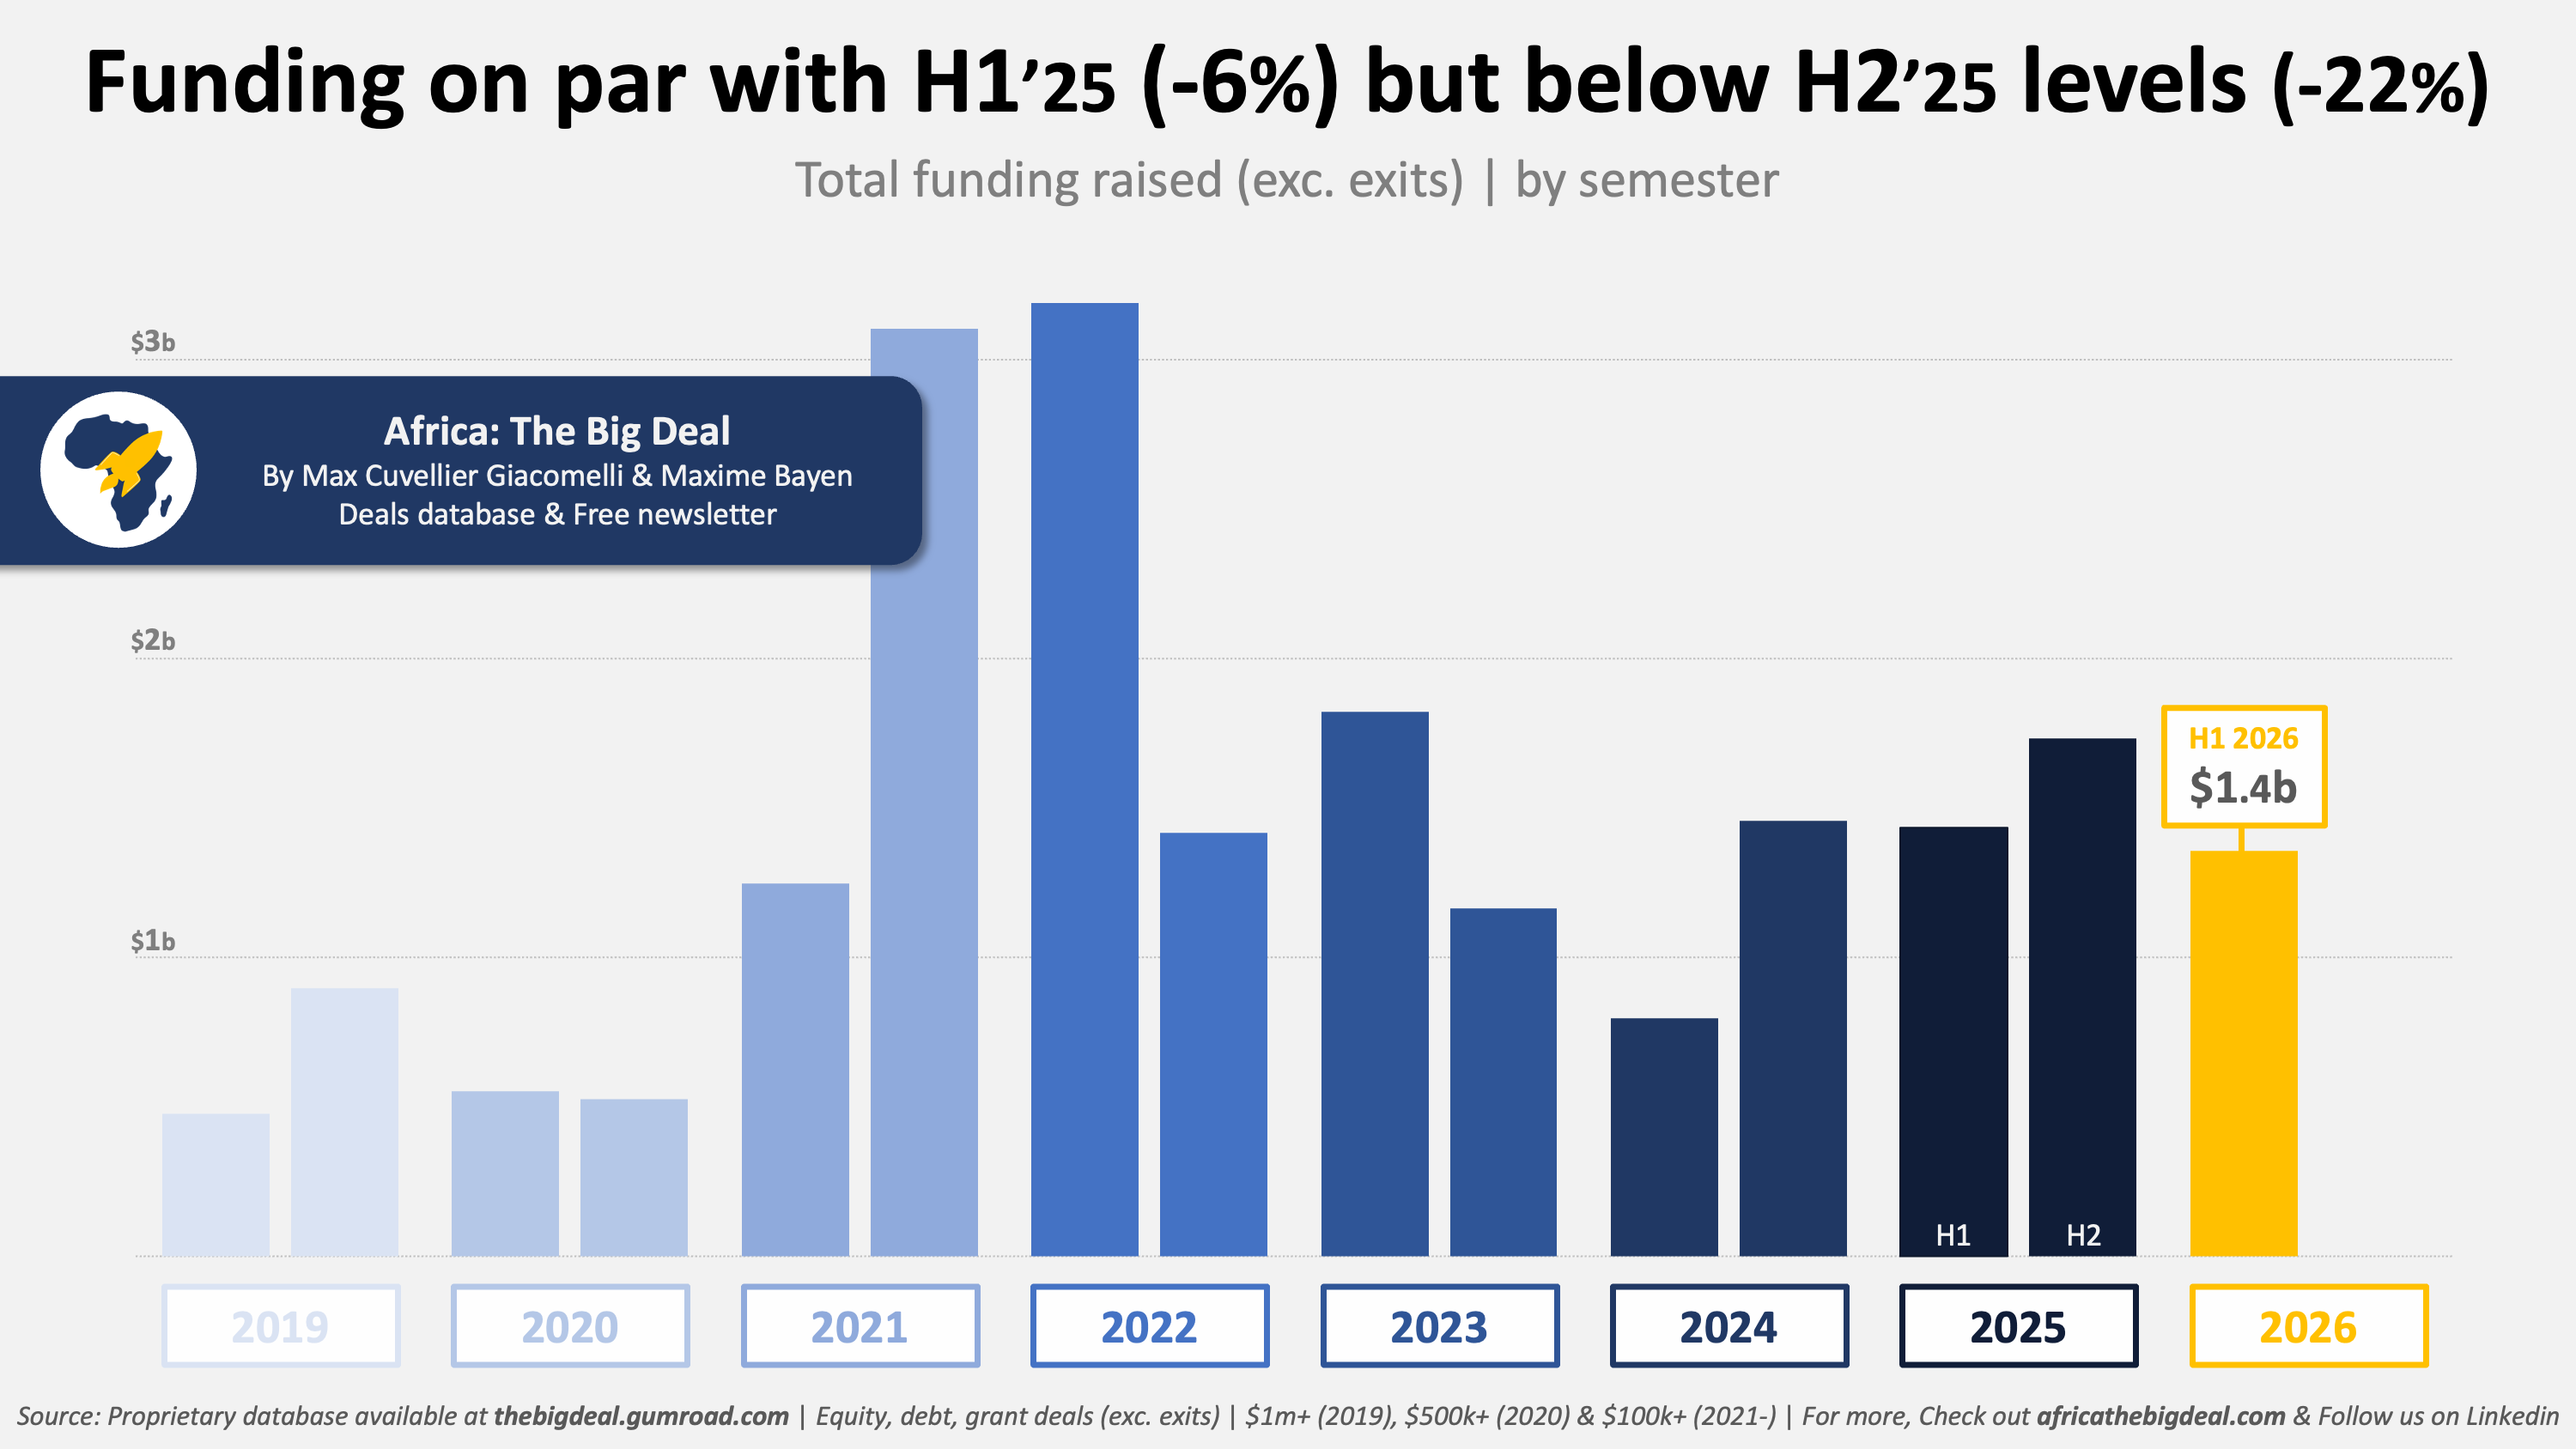
On the total funding raised, with $1.36 billion announced, H1 2026 is roughly on par with H1 2025 ($1.44b, -6% YoY), but below H2 2025 levels ($1.7b, -22% YoY). The rebound observed in the second half of 2025 doesn’t seem to have endured.
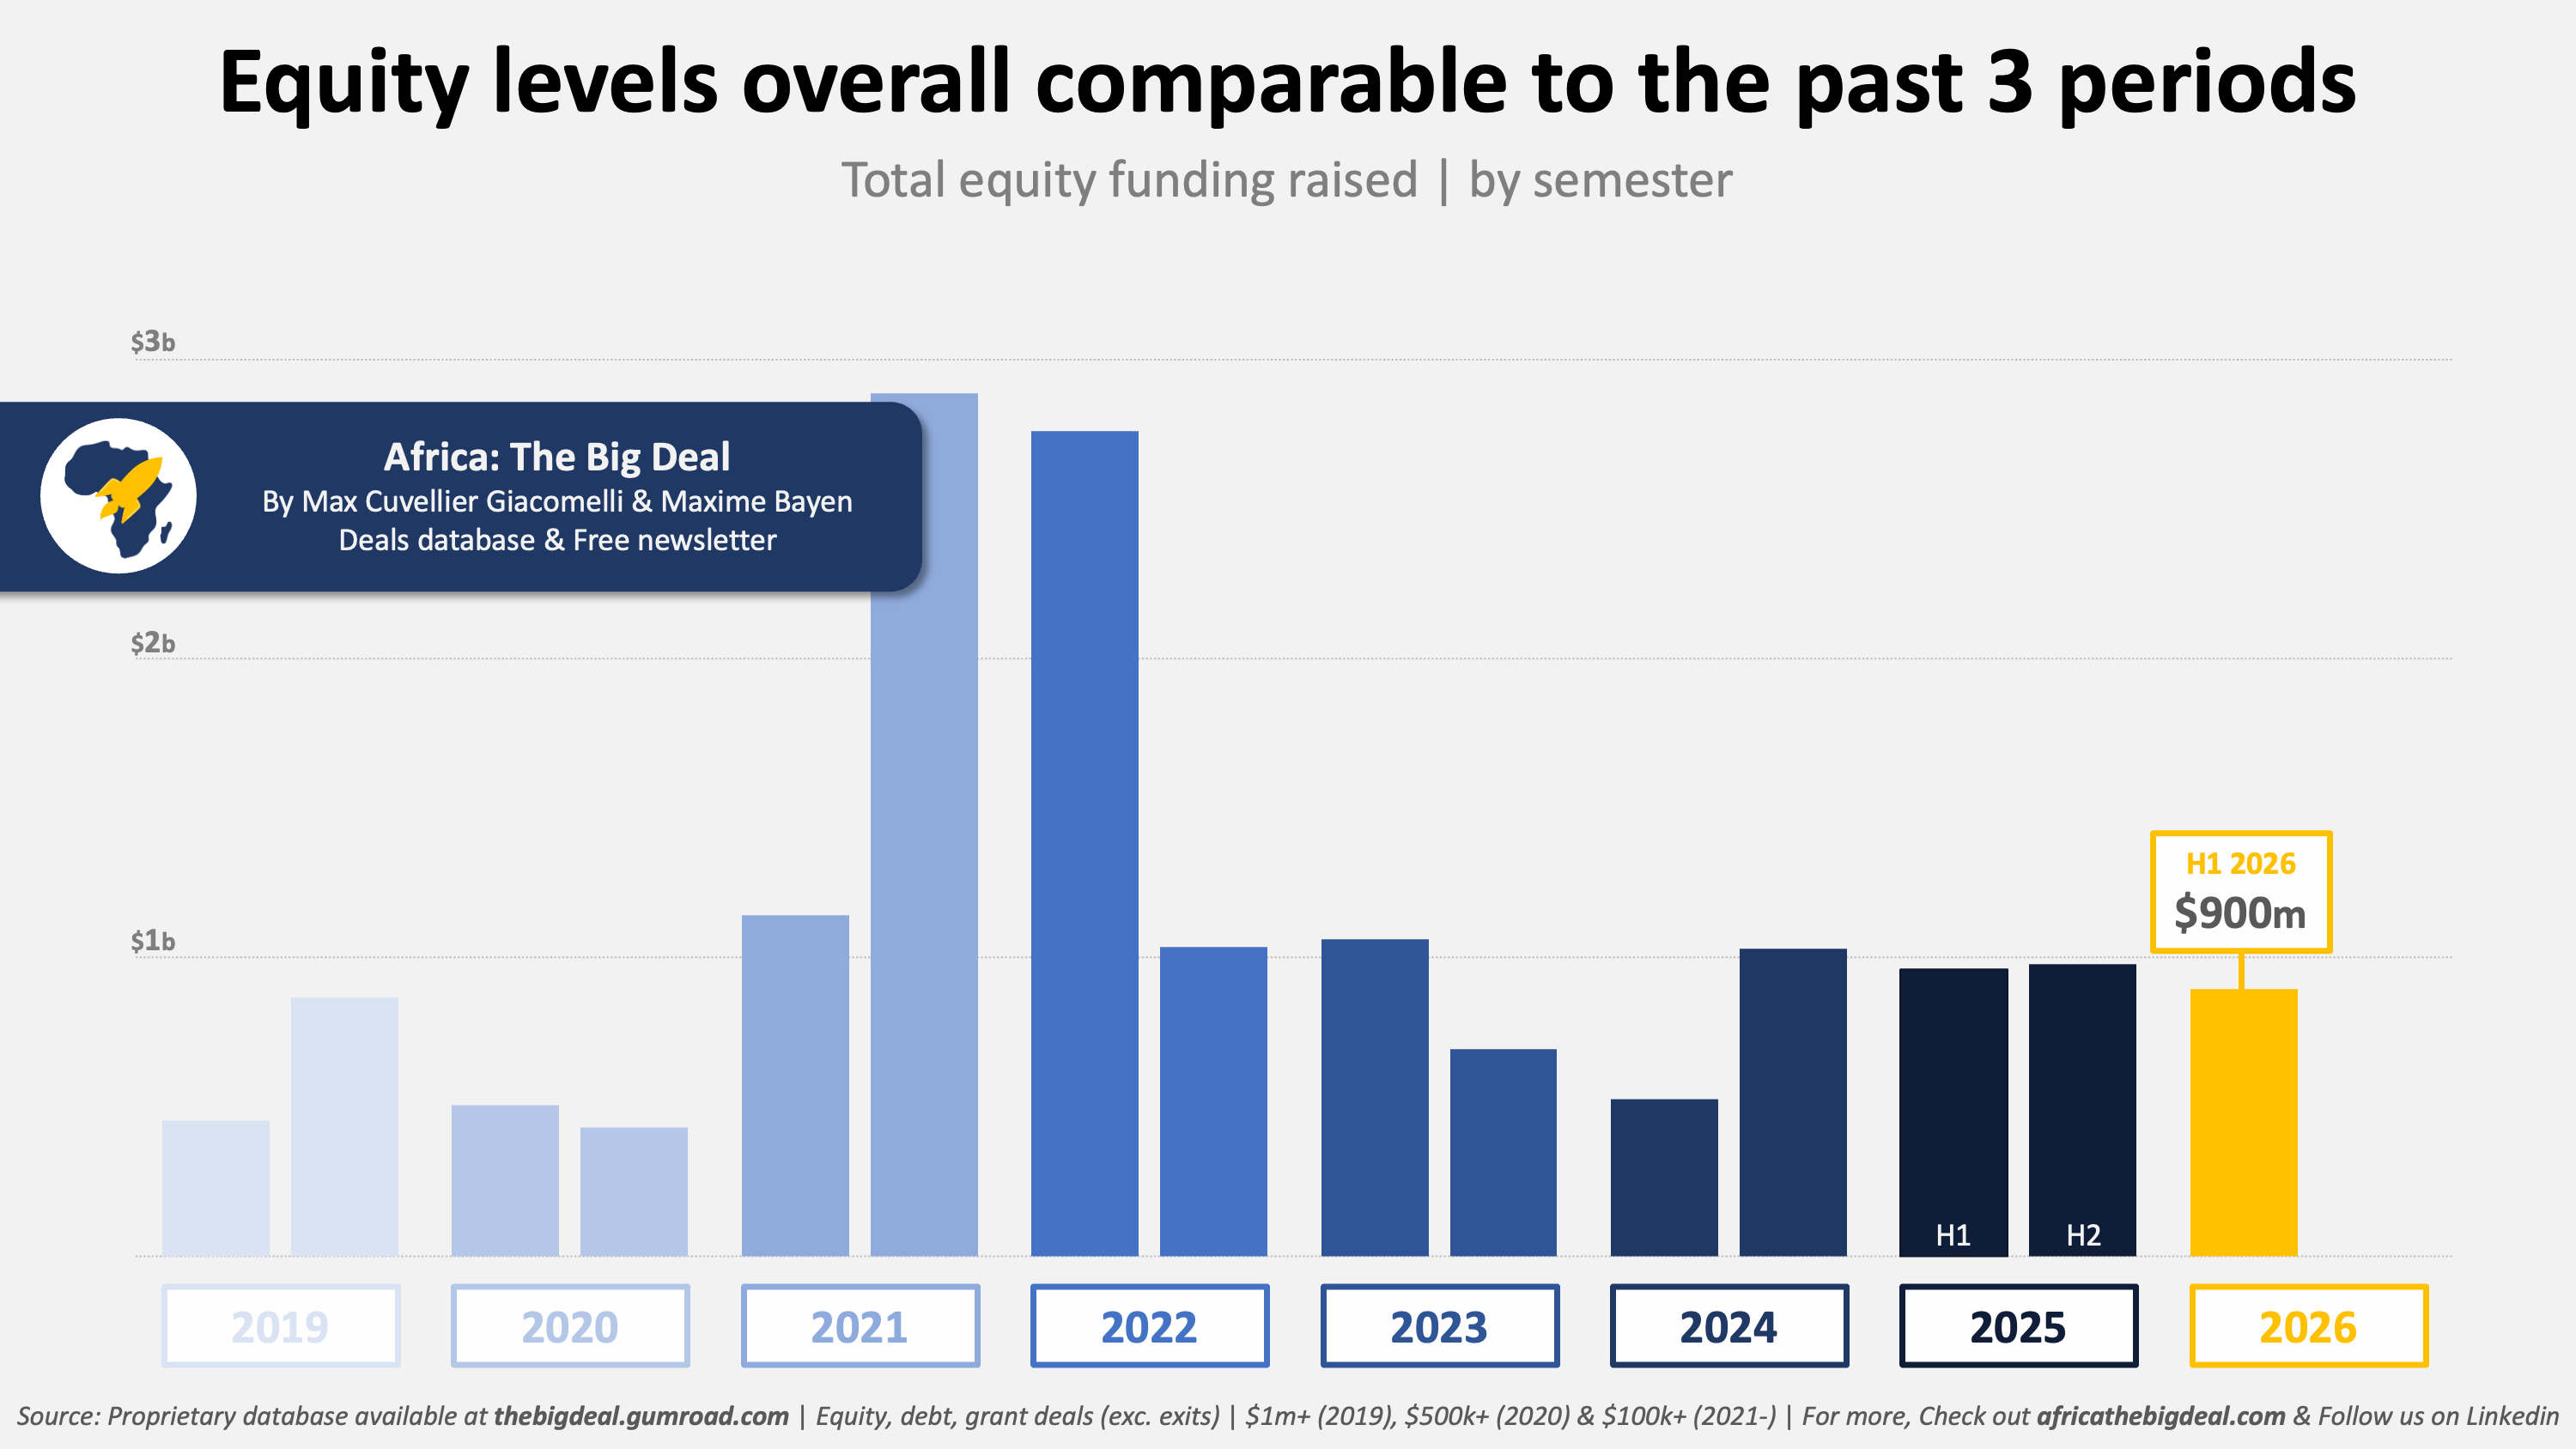
Equity funding reached $900m. While it has been eroding slightly over the past three periods ($1b in H2 2024, $962m in H1 2025 & $979m in H2 2025), we should note the relative stability, especially compared to the previous dip in late 2023-early 2024.
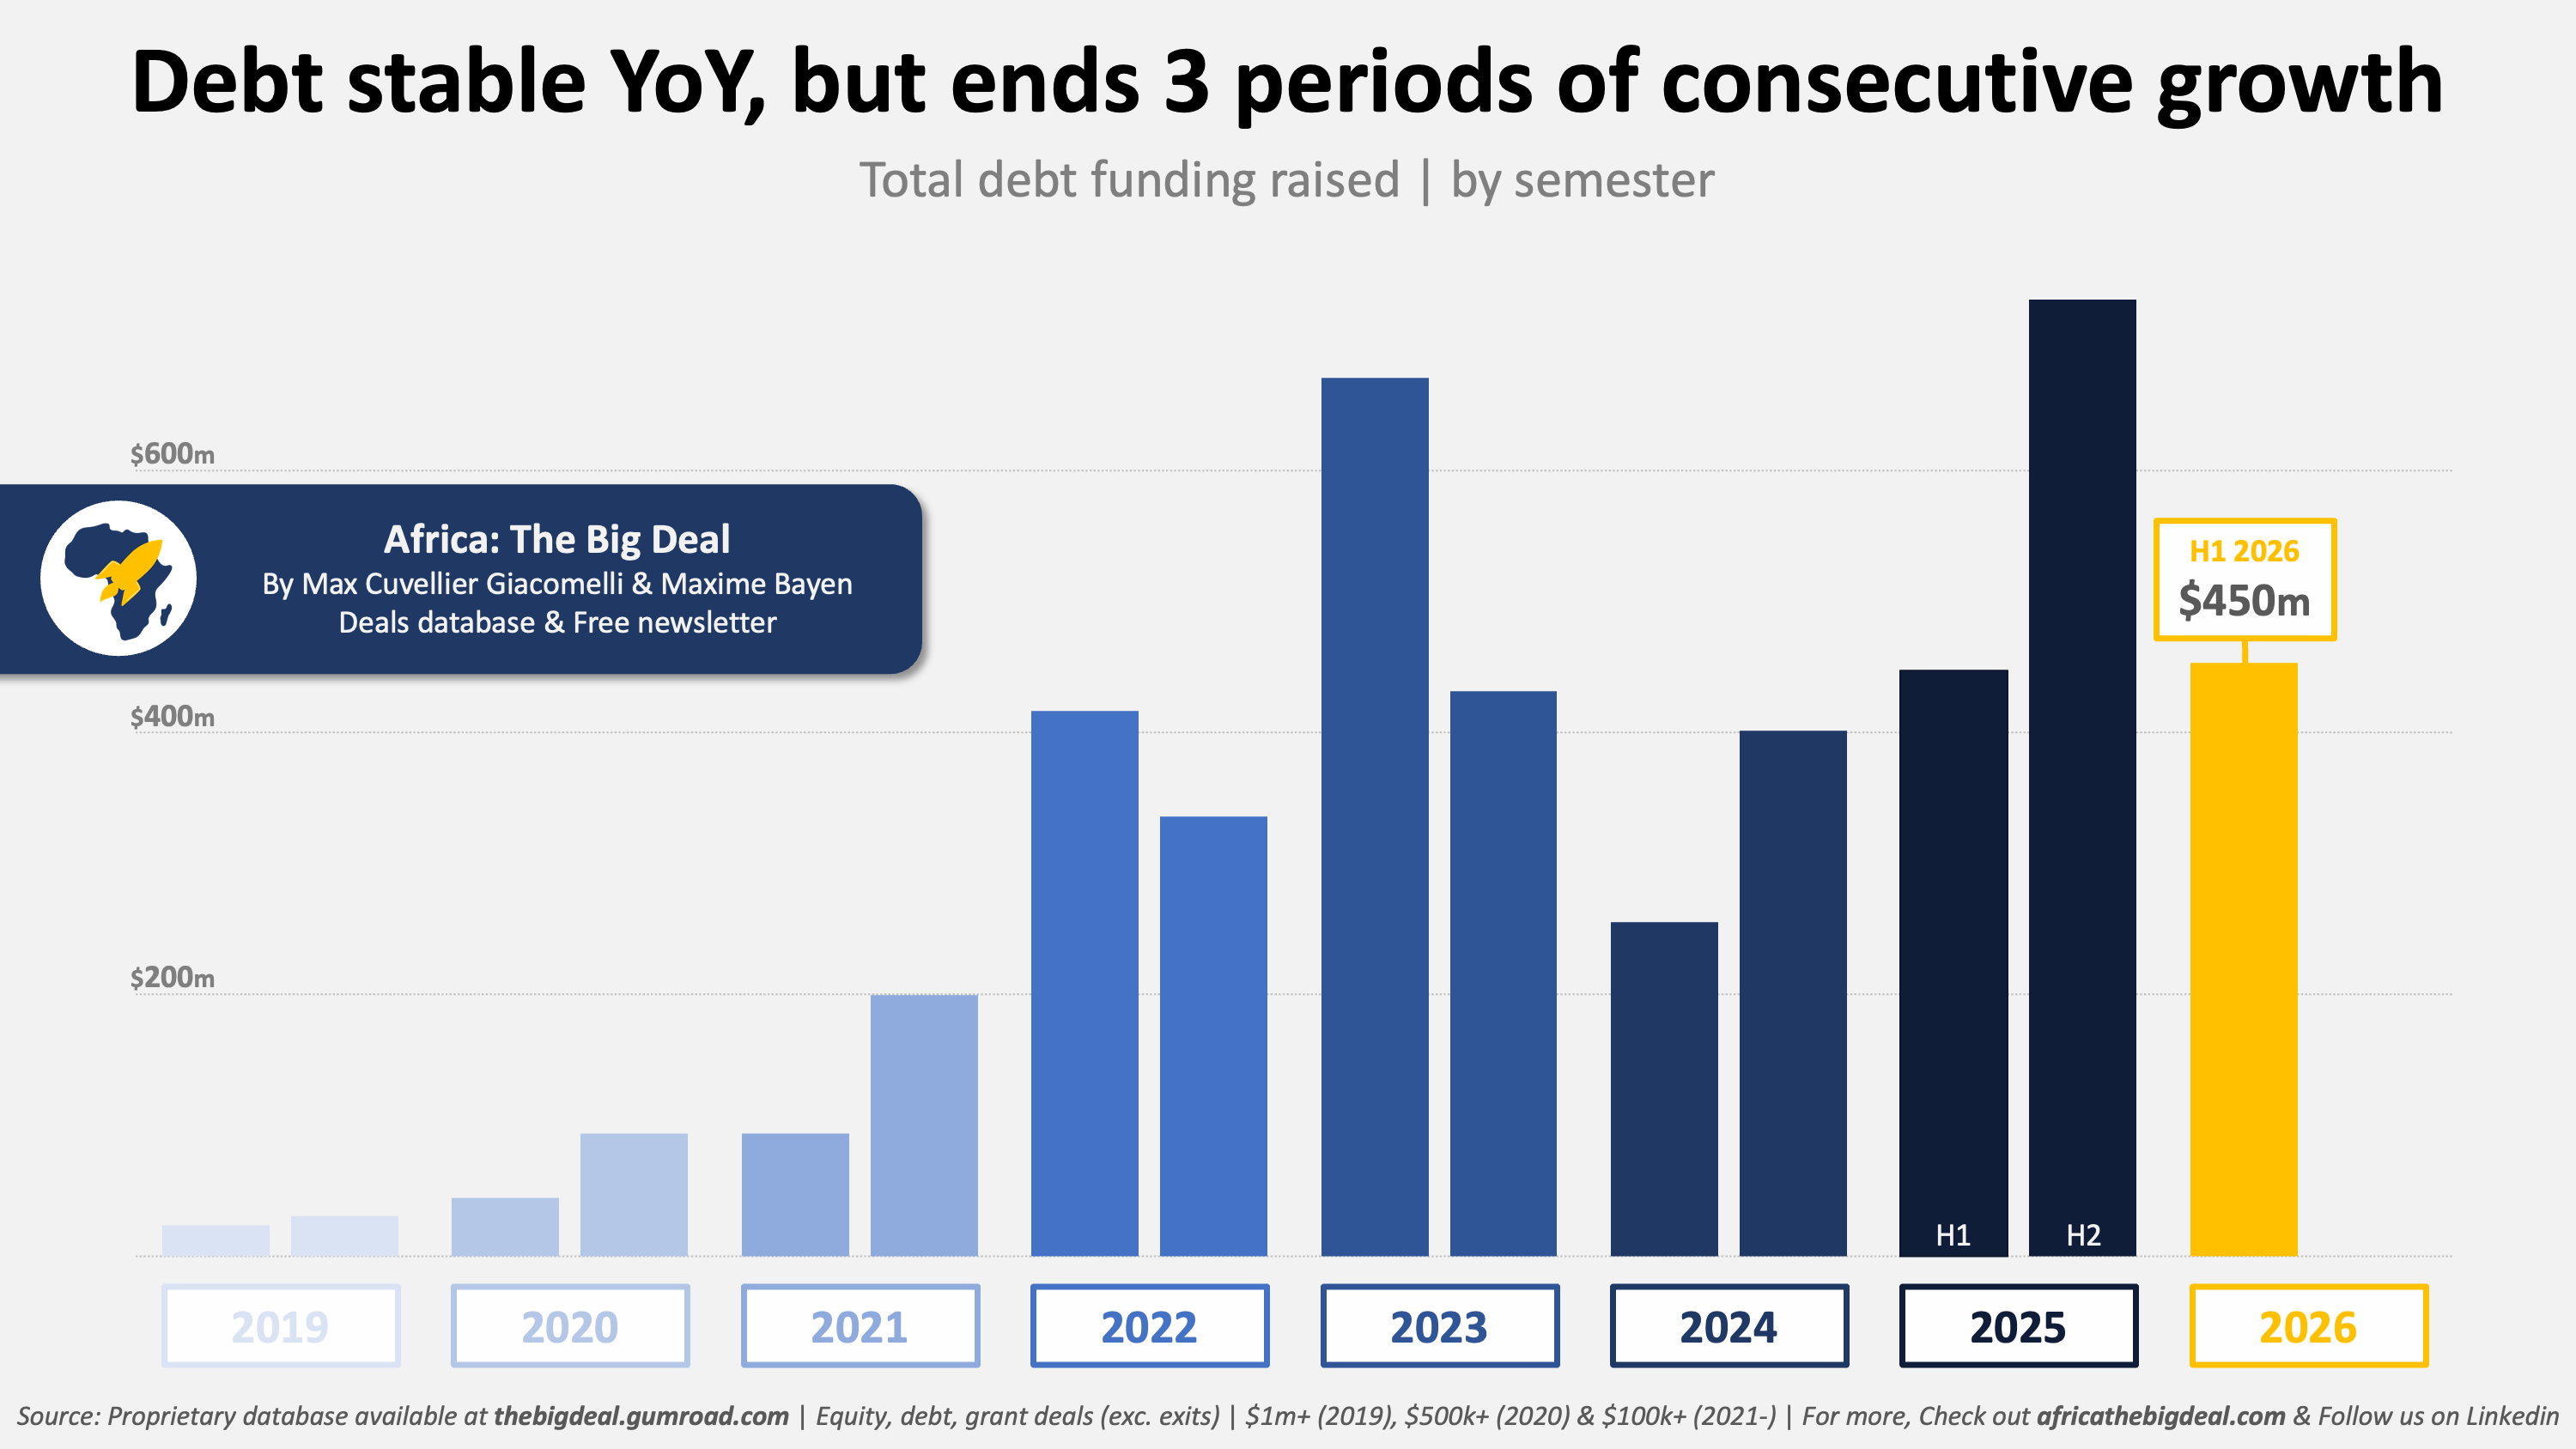
Debt funding had mixed results in H1 2026 though: while it remains on par with H1 2025 numbers ($450m, +1% YoY), it marks the end of three consecutive periods of HoH growth. The result is a 66%:33% equity:debt split (vs. 56%:42% in H2 2025) more titled towards equity.
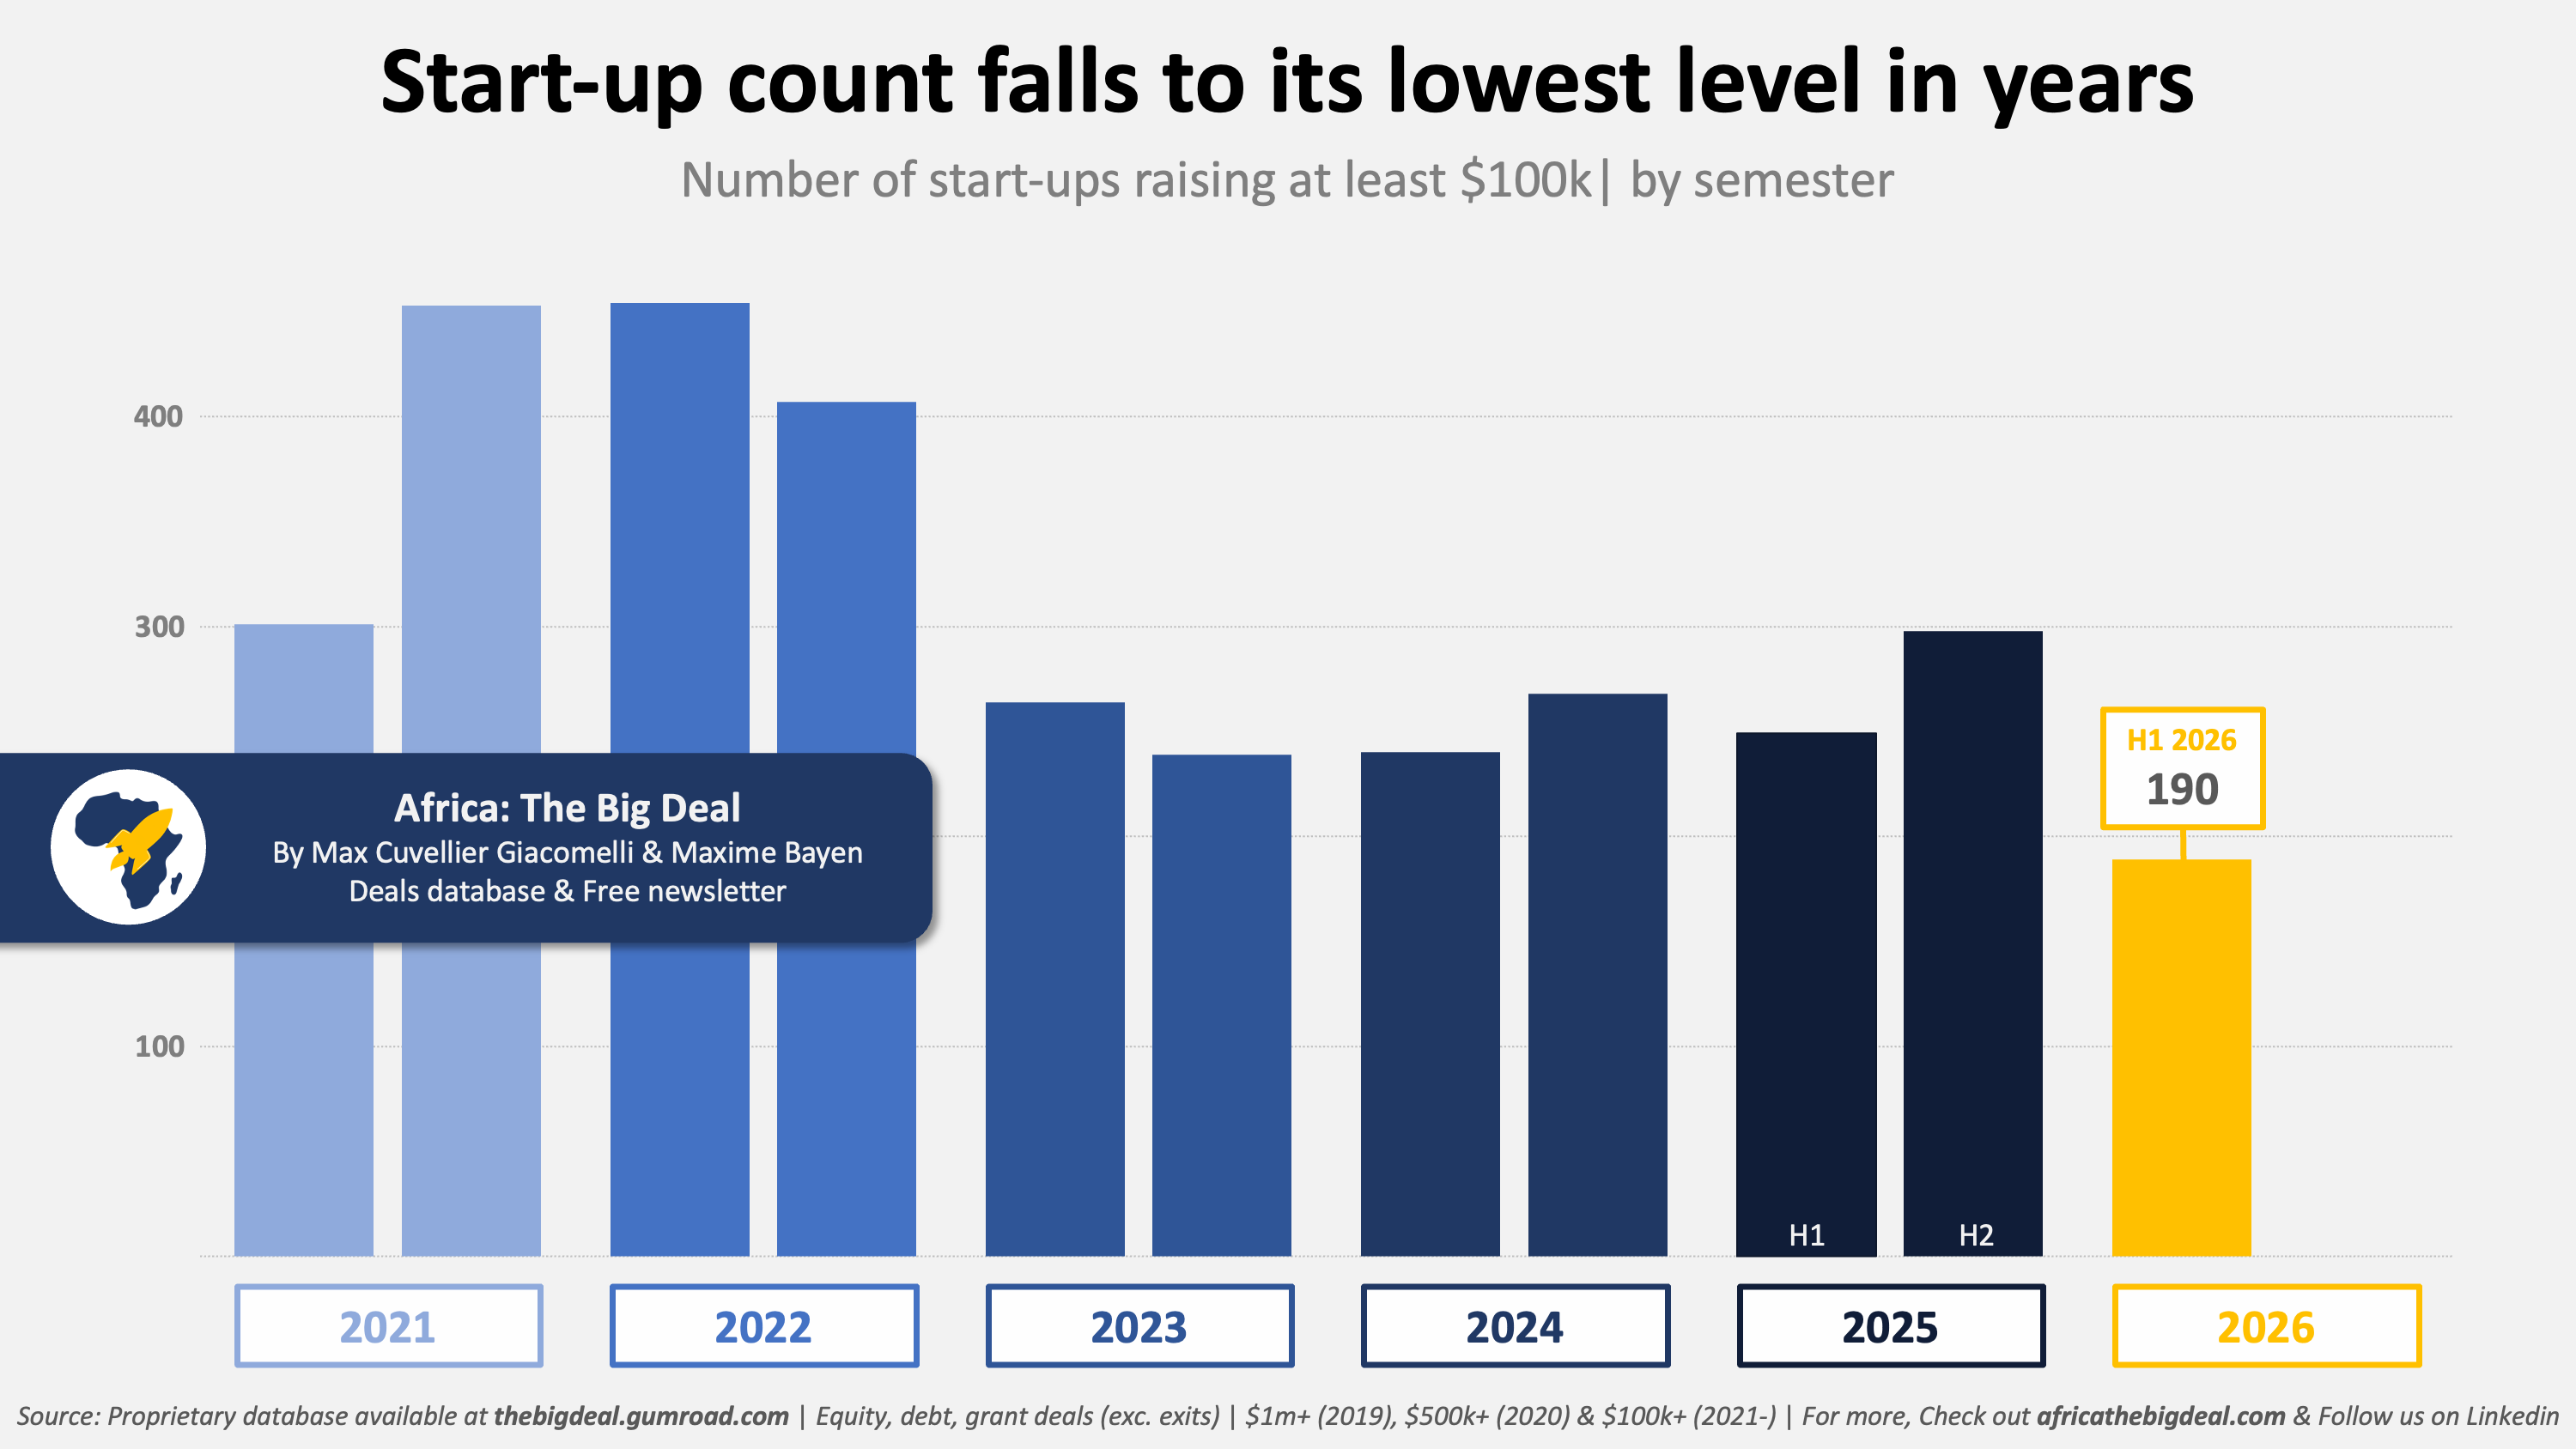
Meanwhile, one indicator is a cause for concern: the number of ventures raising $100k+ during the period. At 190 start-ups, this is the lowest tally since at least 2021 (when we lowered our tracking threshold to $100k). And the category that suffered the most are start-ups raising between $100k and $1m, down from 179 in H2 2025 to 100 in H1 2026 (-44% HoH). We have covered this issue repeatedly in the past few months (see here and here): the underinvestment in early stages will eventually create a pipeline issue unless it gets corrected swiftly.
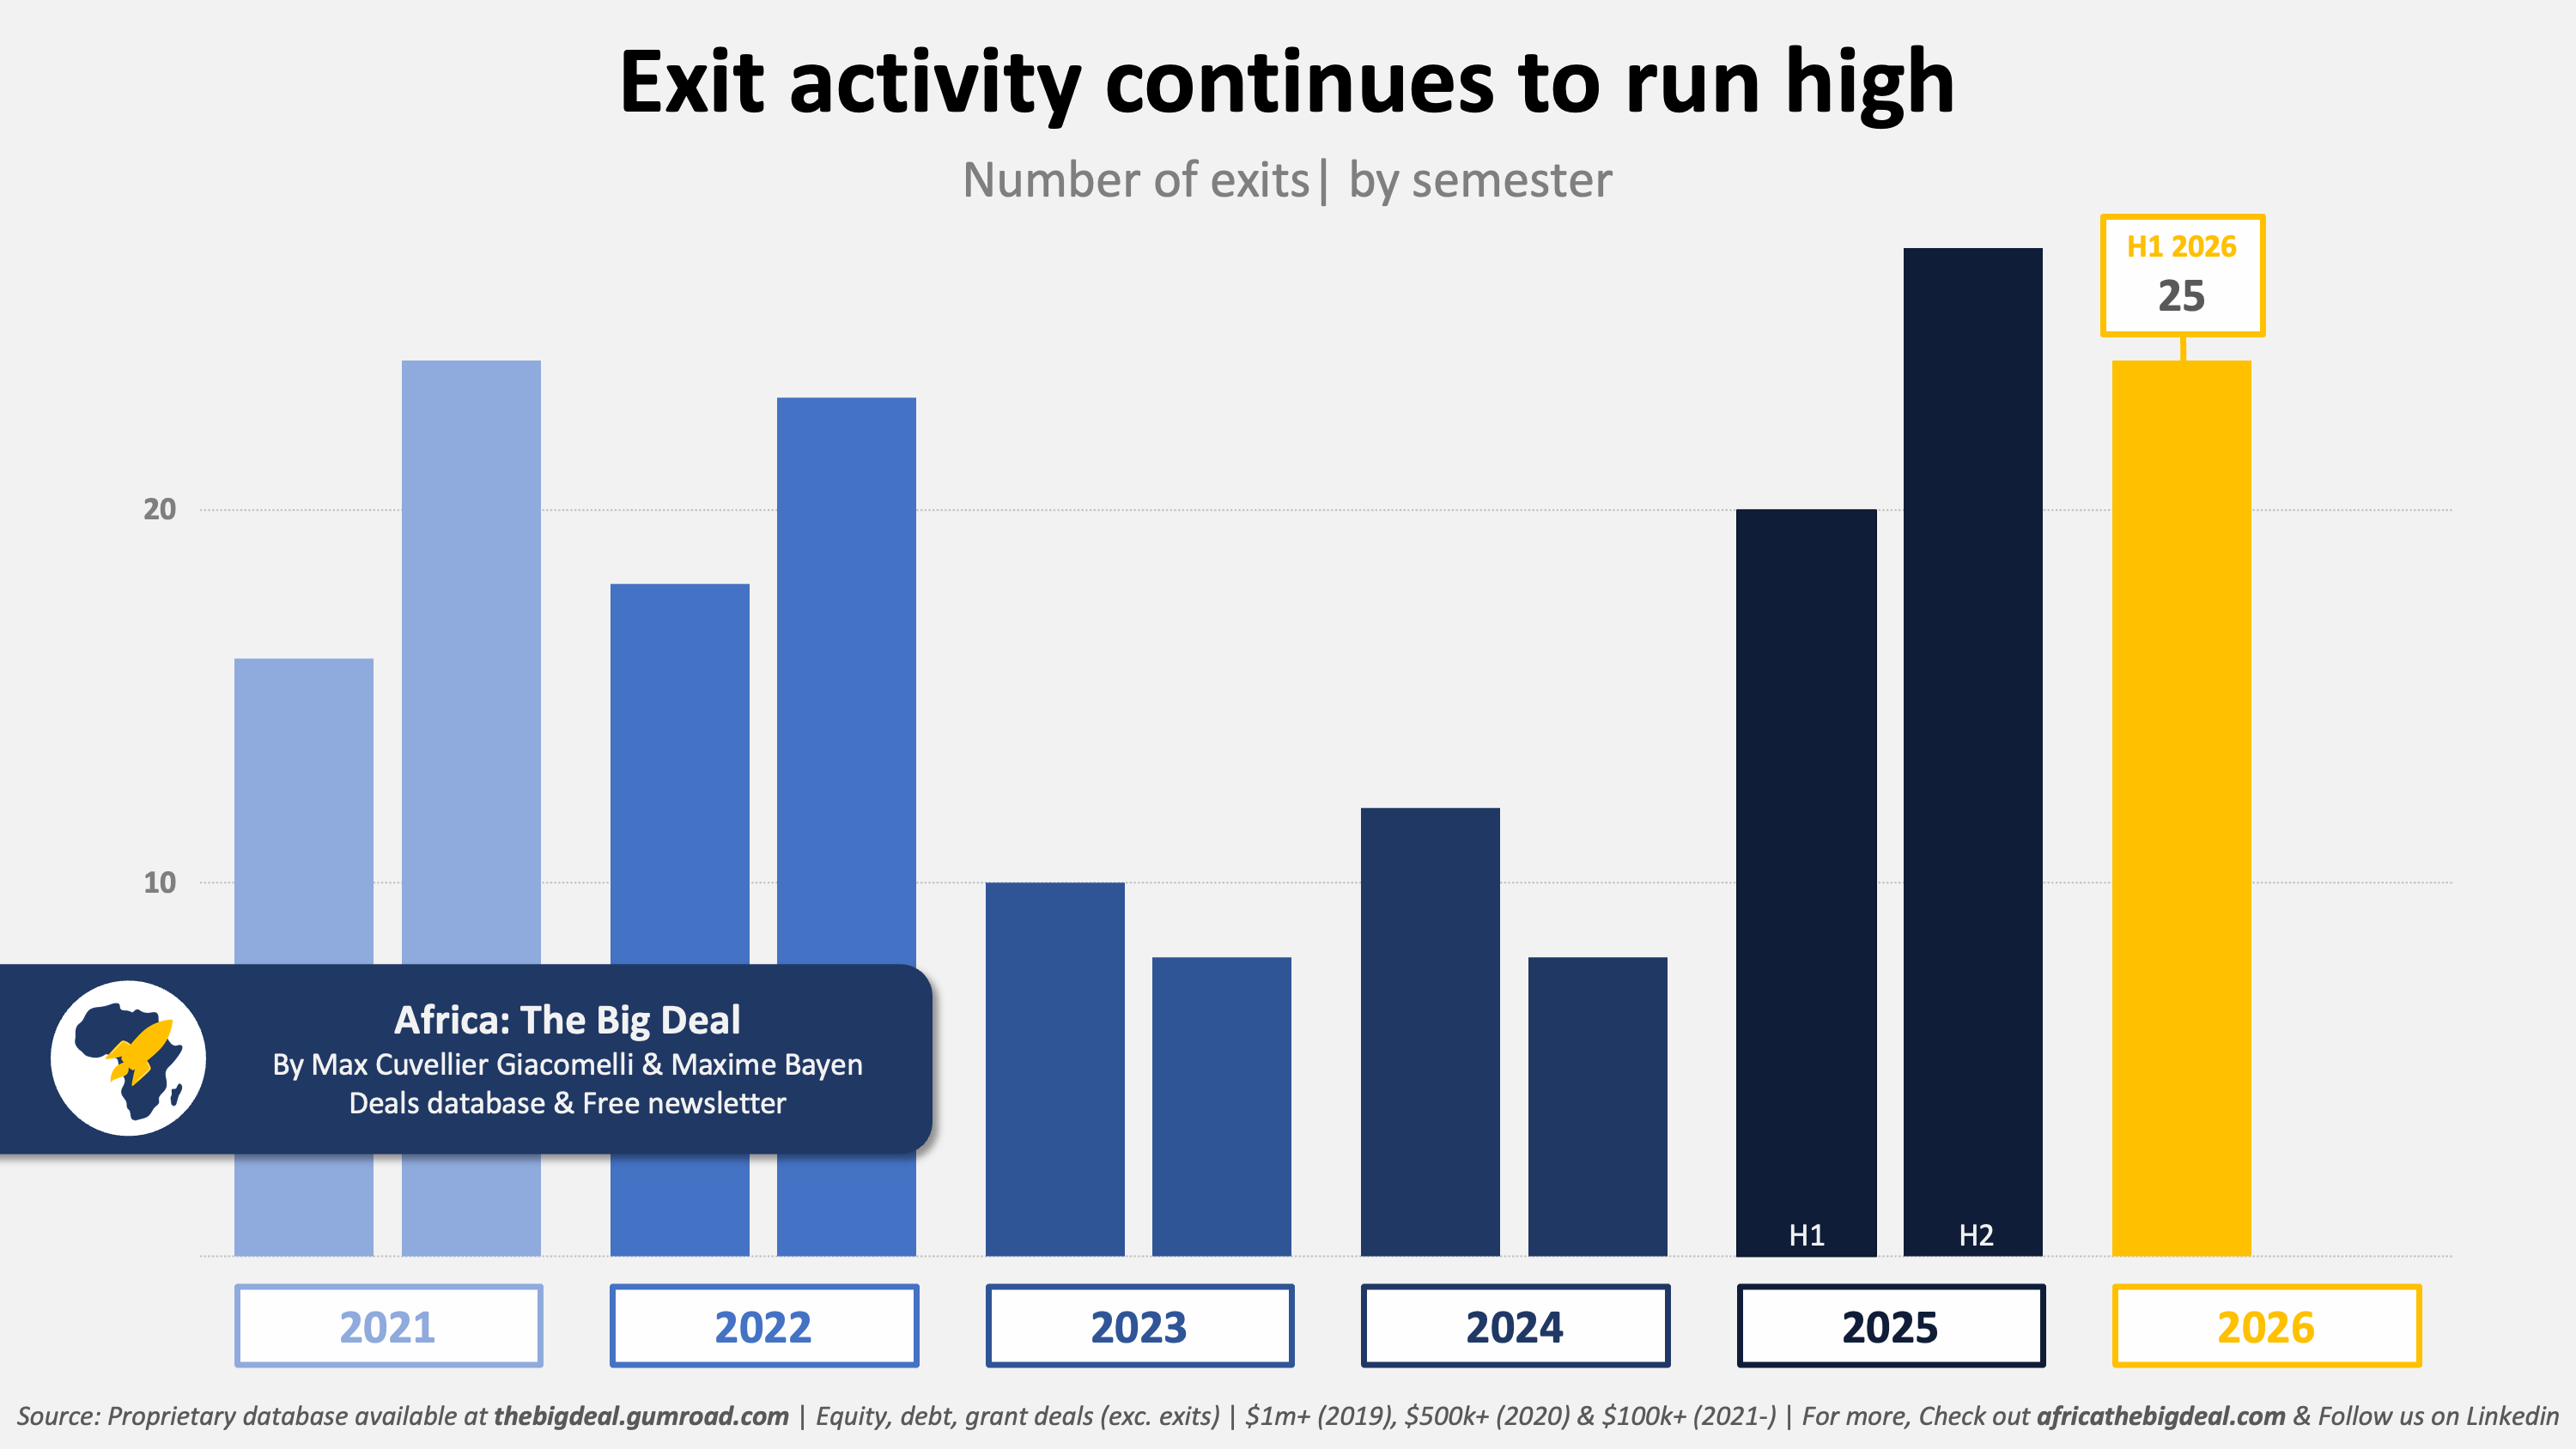
Let’s end on a high note though: with 25 exits, H1 2026 was a very good semester. Those included Mono’s acquisition by Flutterwave in Nigeria ($25m-$40m) and Araxi’s acquisition of Pay@ for $62m in South Africa. The ecosystem could well be on track to beat its 2025 record (48). This is an important signal to convince investors of both the potential and liquidity of the African ecosystem.
We’ll stop here for today but will return soon with the geographic breakdown. As usual, this week’s analysis data comes from our proprietary Africa: The Big Deal database where we have been tracking start-up investment activity on the continent since 2019. The full dataset is available for a modest $19 a month via this discount link. Your support in sharing our work with your network - whether the database or this free newsletter - is greatly appreciated. Bonne journée! Max