Does size really matter?
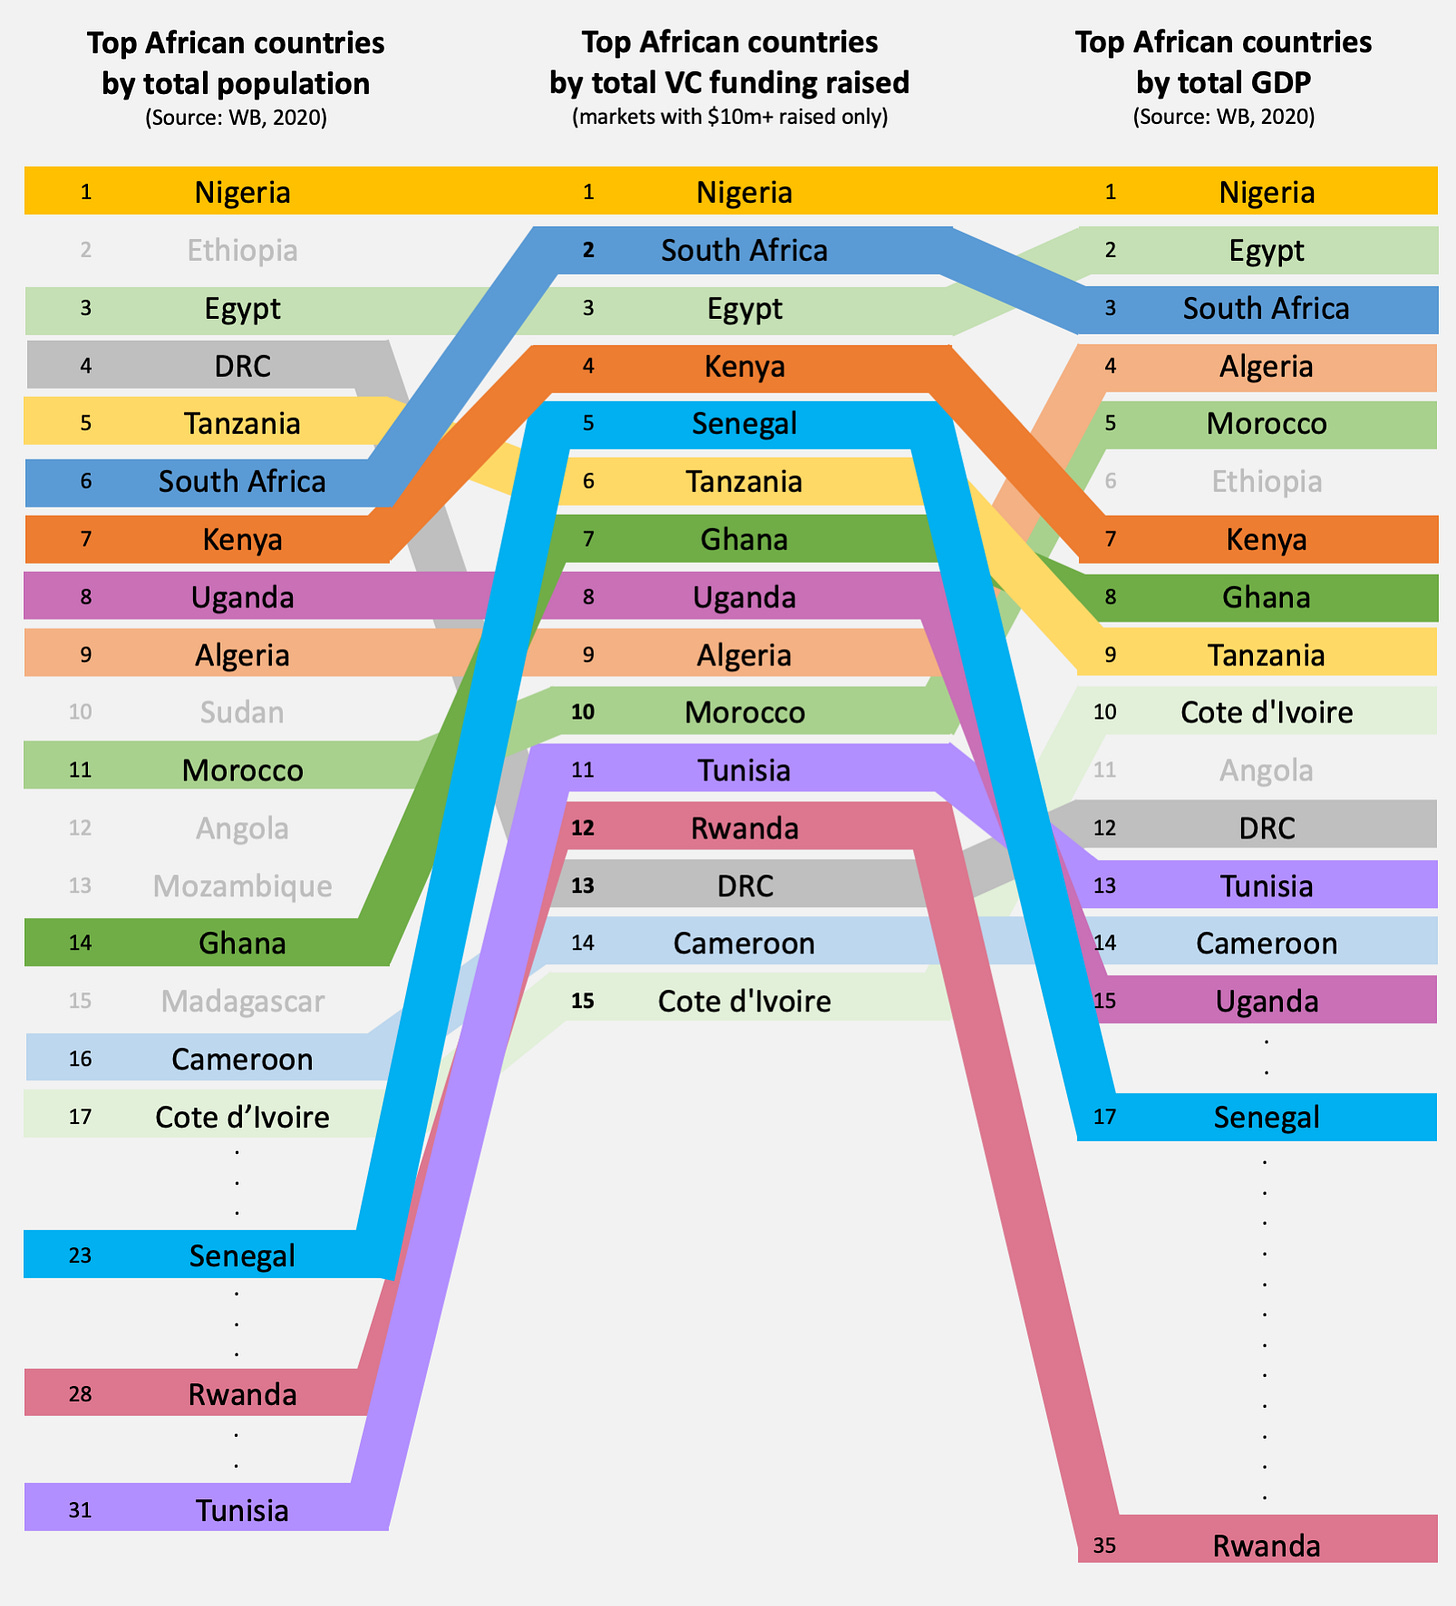
Of the top 10 markets in terms of start-up funding raised in 2021, 7 and 8 are also in the top 10 in terms of population and GDP respectively
Often when we share a breakdown of funding raised by country (I’ve reshared the latest map below for ease of reference), some argue that the numbers are skewed by population - and therefore market - sizes. It is a valid point to make of course; after all, Nigeria is about 2,000 times more populated than the Seychelles... Overall, of the 10 most populous countries in Africa, 7 are in the top 10 in terms of funding raised; Ethiopia (#2 in population* vs #20 in funding raised), DRC (#4 vs. #13) and Sudan (#10 vs. #19) are the ones missing the mark. The three countries punching above their population weight are Senegal, Ghana and Morocco. If we look at funding per capita (amount raised divided by population), the continental average ($3.2 pc) is an interesting comparison point but one shouldn’t read too much into it, as it hides very strong differences. South Africa is leading the way with close to $16 raised per capita. It is followed by Senegal ($13.3 pc; $1.3 pc if we exclude Wave’s $200m Series A though). Kenya and Nigeria are on par: Nigerian start-ups raised about 4 times the amount raised by their Kenyan counterparts, but the population ratio is also around 1:4. Egypt closes the top 5. All other countries fall below the continental ‘average’: from $2 (Tunisia) to $0.1 (DRC), with the notable exception of Namibia ($8.2m for a population of 2.5m i.e. $3.2 pc). Another interesting exercise is to compare funding raised and GDP*. Of the 10 countries with the highest GDP, 8 make it to the top 10 in terms of funding raised. Ethiopia again (6th largest economy, #20 in funding raised) and Cote d’Ivoire are the exceptions, replaced in the top 10 by Senegal and Uganda. In terms of funding raised expressed as percentage of total GDP, the continental ‘average’ stands at 0.18% of GDP. Senegal (with $222m raised for a GDP of approx. $25b) is way ahead of the group (0.9%), followed by Kenya (0.41%), Nigeria (0.36%), South Africa (0.28%) and finally Egypt (0.16%).
It would obviously be interesting to compare funding - in absolute numbers, per capita and as a percentage of GDP - to other regions, but that’s for another story 😉 We always enjoy seeing our maps and graphs pop up on social media or in presentations, so don’t hesitate to share them!
In case you missed it, I’m also including this extra graph I later published to complement this post:
* Source: World Bank, 2020


